Visualises the results of a Prism Analysis using one of several diagnostic plots.
Arguments
- x
A
PrismReportobject returned byprism.- y
Ignored; included for compatibility with generic plot.
- type
Character string specifying the plot to display. One of
"radial","circular","bubble", or"radar".- feature
Character string specifying the variable to display when
type = "radar".- ...
Additional graphical arguments reserved for future extensions.
Details
Available visualisations include:
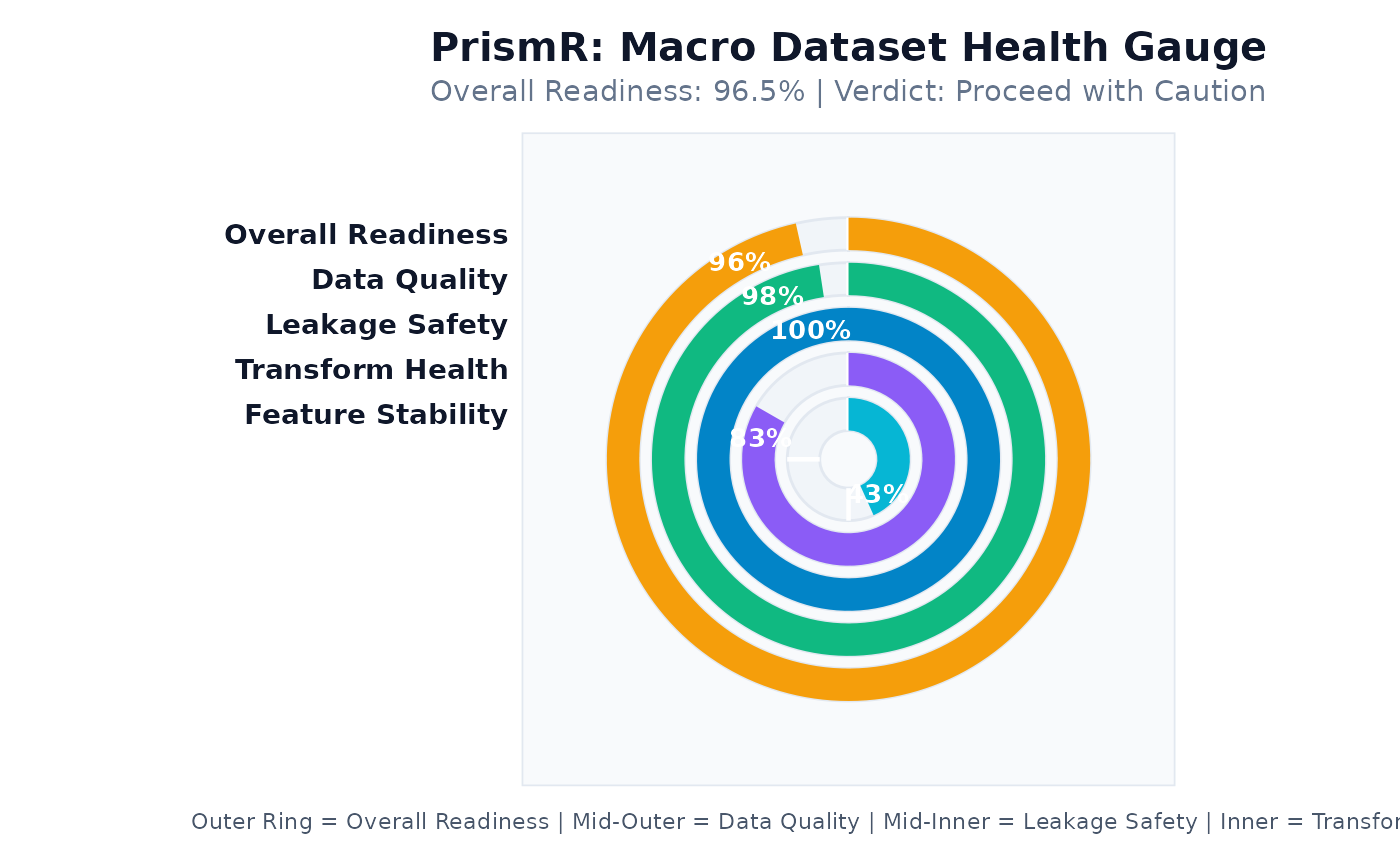
radial: Radial/gauge chart summarising the overall health of each PrismR module and dataset readiness.
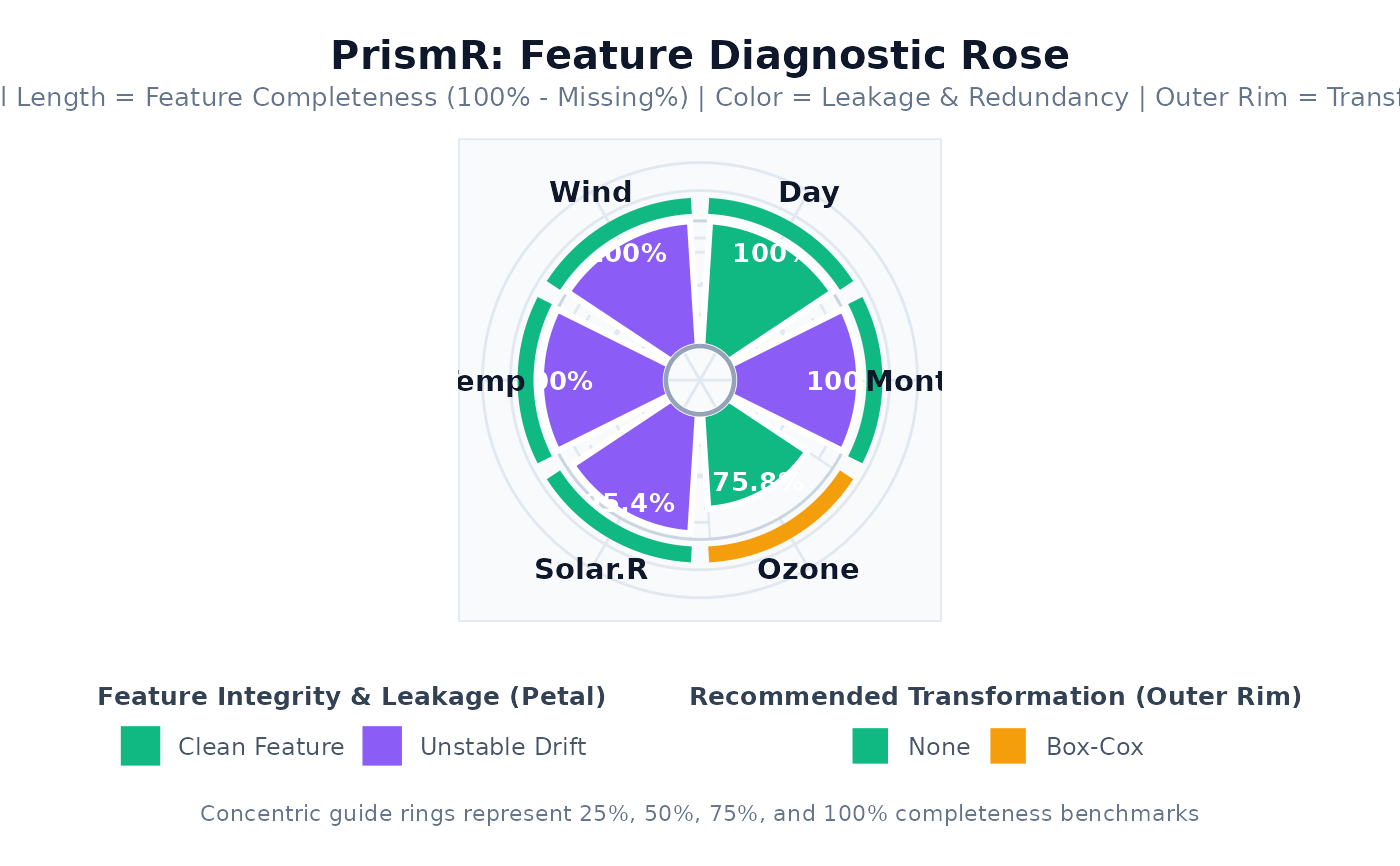
circular: Feature Diagnostic Rose (coxcomb) displaying feature Completeness (petal length), Redundancy & Leakage Status (petal color), and Recommended Transformation (outer rim cap) around an open donut center.
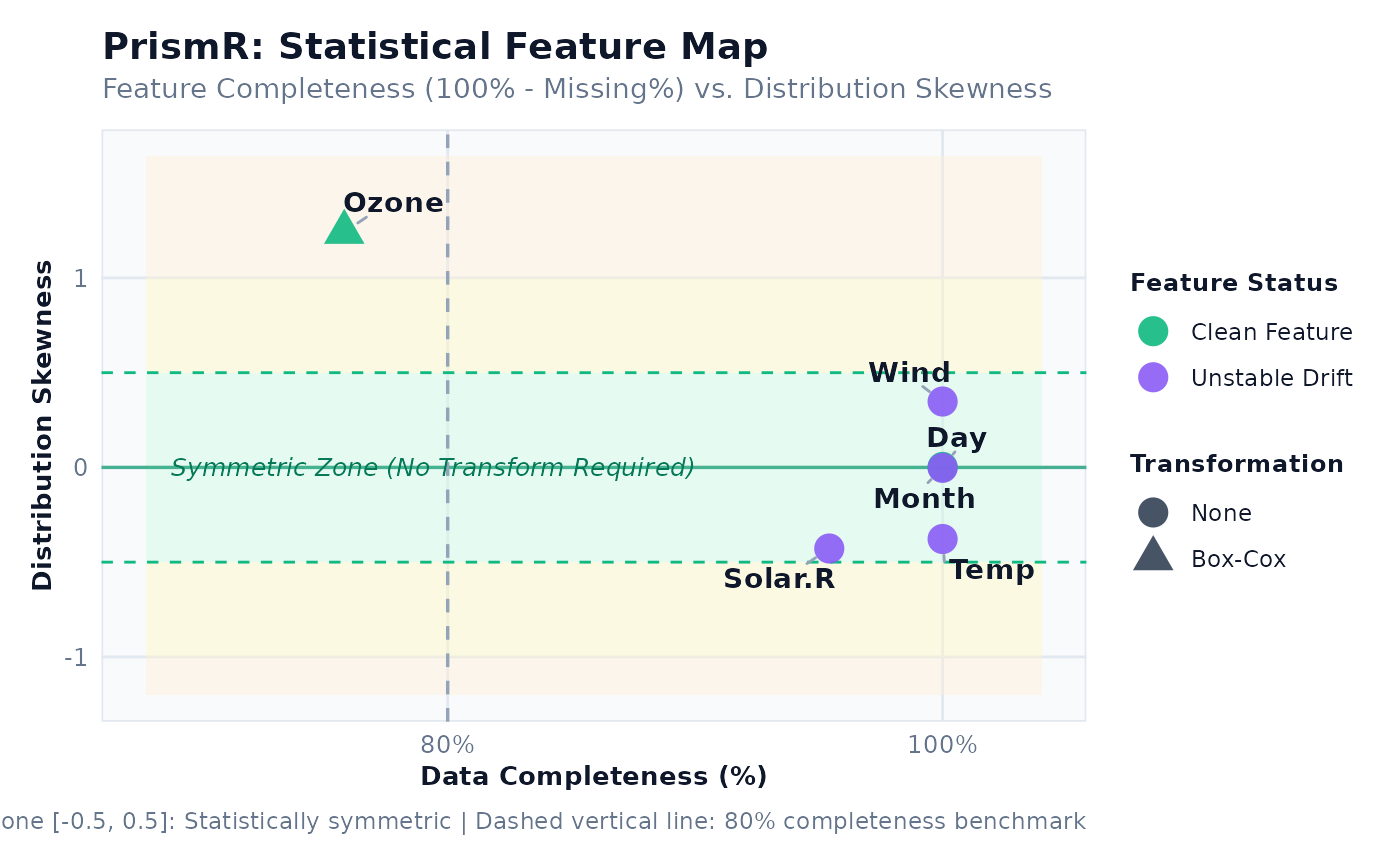
bubble: Statistical feature map displaying Data Completeness (100% - Missing%) versus Distribution Skewness, with leakage vector colors and transformation shapes.
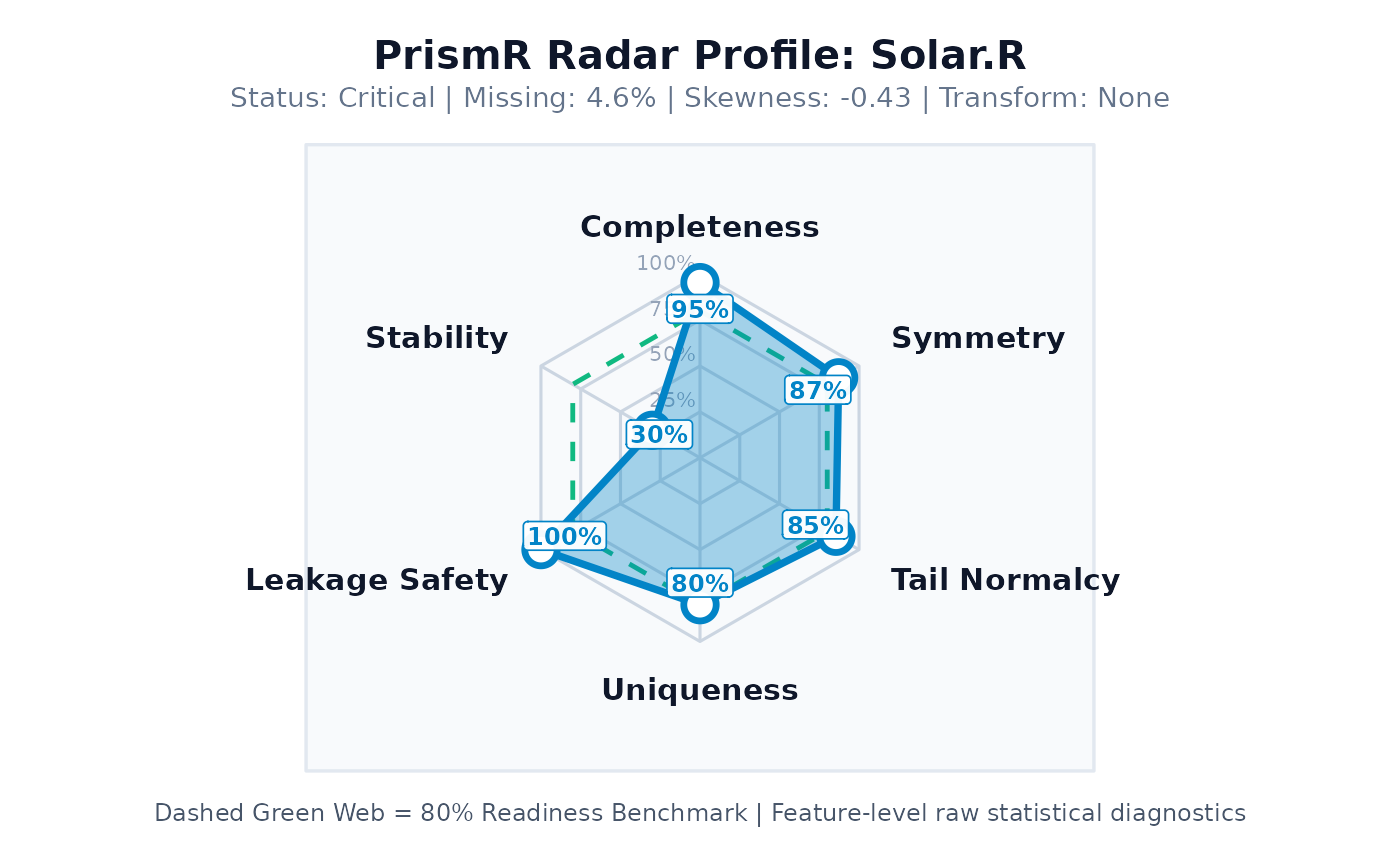
radar: Spider/radar chart displaying the raw statistical diagnostic profile of a selected variable (Completeness, Symmetry, Tail Normalcy, Uniqueness, Leakage Safety, and Feature Stability).